
- Details
- Written by Dr. Duke
- Category: Dr. Duke's Blog
- Hits: 2445

As I watched the Standard and Poors 500 index (SPX) trade upward so strongly today on the news of agreement on a final tax reform bill, I couldn’t help but think of that old television show, Happy Days. Are we off on another leg up of this remarkable bull market? Are Happy Days here again?
SPX spiked to another all-time high today, closing at 2676, up just under one percent. But the spike in trading volume was truly remarkable. Trading volume for the S&P 500 companies ran below the 50 day moving average (dma) at 2.1 billion shares all week. But today’s volume hit 3.5 billion shares, the highest level seen in SPX all year. It certainly appears to have been an “all in” day as the poker players would say. But is that appropriate?
I think most, if not all, market analysts would attribute today’s spike to the news that a final version of the tax reform bill was ready for release and congressional leaders think they have the votes for passage next week. But passage in the senate is anything but a slam dunk. That fragile majority could easily unravel. If that happens, look out below!
I also worry about the market’s reaction to passage of the tax reform bill. Will this be another “sell the news” moment? In many ways, my position on this market hasn’t changed. I continue to play the bullish market trend, but I am increasingly cautious.
The volatility index for the Standard and Poors 500 index, VIX, remains relatively low. VIX opened the week at 9.7% and rose to 10.5% on Thursday, but closed today at 9.4%. VIX tells us that Happy Days are indeed here again. But that worries me. Maybe we are too comfortable. The market has been rather volatile over the past couple of weeks. Many of the market darlings have been whipsawed back and forth. Passage of a tax bill will certainly push the market higher, but it could also be a “sell the news” moment. The spike in today’s market worries me when the bill’s passage is anything but certain. Black swan events have a tendency to occur when everyone is fat and happy.
Be cautious. This is a nervous market and next week could bring some big moves higher or lower. Keep a close watch on your positions and set tight stops.
- Details
- Written by Dr. Duke
- Category: Dr. Duke's Blog
- Hits: 2628
The Standard and Poors 500 index (SPX) took a serious hit on December 1st due to the double whammy of what turned out to be a false news story about Trump and some concerns that the tax bill had hit a wall. The concerns that tax reform would not be passed continued to haunt the market on Monday. Many of the high-tech darlings that have performed so well this year were badly hurt on one or both days. But Thursday brought a new optimism to the market and SPX even gapped open higher on Friday morning.
Market analysts have been debating whether a presumption of passage of a tax bill has been “baked into” the current market prices. I have certainly found my thinking to waffle back and forth on this question, but recent market price action has convinced me that a failure to pass the tax bill this year will result in a pullback in the markets. The questions are the degree and duration of the pull back.
The most recent earnings cycle certainly documented solid corporate earnings growth, and that is the foundation of a strong bull market. But it is also true that several technical indicators have been suggesting an increasingly overbought market.
SPX opened Monday at 2657 and that tied the intraday high on November 30th. SPX closed Friday at 2652 so we have spent the last seven trading sessions trading sideways. This level of the market is the tipping point between higher prices upon passage of the tax bill and lower prices if it fails to pass. How much lower? That is hard to predict, but I will be looking at the support levels on SPX at 2596 and 2565. I think it is unlikely for the market to break those support levels.
Consider the pattern of trading volume for the S&P 500 companies. Recent trading volume has been relatively low, running at or slightly above the 50-day moving average (dma). When the market tanked on 12/1, 12/4, and 12/5, trading volume spiked higher. But when the market strengthened on Wednesday through Friday of this week, trading volume fell below the 50 dma. That pattern suggests that many more shares are prepared to be sold on any sign of weakness than are willing to “go all in” on a perception of strength.
The Russell 2000 Index (RUT) displayed a strong run for the last half of November. Many attributed this to a perception that the tax reform bill would be more helpful to smaller companies, such as those of the Russell 2000 index. And this perception appears to have been validated by the price behavior since December 1st. Once passage of a tax bill began to be doubted, RUT traded lower. Look at how far RUT fell on Friday, 12/1, touching the 50 dma before bouncing back higher. Wednesday’s price action broke support set by the early October high and the pause on November 21-27. But Thursday and Friday recovered some of those losses, closing at 1522 on Friday.
The volatility index for the Standard and Poors 500 index, VIX, spiked to an intraday high of 14.5% on December 1st, but began a steady decline this week, closing Friday at 9.6%, near lows for the year. This completed a full cycle from the low of 9.7% on November 24th to the high on 12/1 and back to 9.6% yesterday. VIX primarily reflects the perceptions of the large institutional traders. For now, at least, they are very complacent.
Where do we go from here? Many of our high flyers were taken to the wood shed last Friday and Monday of this week. But we seem to have recovered by week’s end. Passage of a tax bill will certainly push the market higher, but it could be a “sell the news” moment. The price action of the past six trading sessions suggests a sell off of some magnitude if the tax bill fails to pass out of Congress.
This coming week features the FOMC meeting and announcement and the expectation of a decision on the tax bill by Friday. We may be in for some choppy sideways trading until the fate of the tax bill is finally known. Keep a close watch on your positions and set tight stops. This is a nervous market and this week could bring some big moves higher or lower.
- Details
- Written by Dr. Duke
- Category: Dr. Duke's Blog
- Hits: 2552
It is difficult to tune in any financial program without hearing someone warning of an imminent market correction. Does that mean conservative investors should be moving to the sidelines and going largely to cash? Let’s apply to solid analysis to this question rather than falling for the emotional plea of the doomsday gurus.
The Standard and Poor’s 500 index (SPX) put on a strong run higher from September 27th through October 5th, up 49 points or 2% in seven trading sessions. But last week’s trading results were much more modest, up only two points, essentially unchanged. SPX opened this morning at 2556 and is trading sideways. Are the bulls losing momentum or is this just one more pause in this lengthy bull market? Another way to measure this past week is to note that three of five days were down days and one trading session yielded a doji candlestick, the classic mark of indecision. And it looks like today’s trading in SPX may yield another doji candlestick.
Trading volume of the S&P 500 companies hit a recent low last Monday at about 1.4 billion shares, well below the 50-day moving average at 1.8 billion shares. But trading volume rose the rest of the week, breaking above the 50 dma on Thursday and dipping back a bit Friday, but remaining above the 50 dma. I have to wonder if the lack of progress on tax reform in the Congress is beginning to weigh on this market. I believe this market has priced in tax reform, but many analysts are beginning to doubt Congress’ willingness to pass the administration’s plan. Time is running out.
The Russell 2000 Index (RUT) continued the decline that began the previous week, opening Monday at 1510 and closing at 1502. RUT opened at 1503 this morning and is modestly lower at 1500 as I write this article. These are small losses, but the down trend is becoming clear. The nature of the Russell 2000 index, composed largely small to mid-capitalization stocks, leads me to conclude that money managers are closing their high beta positions, thereby reducing risk. Perhaps they are anticipating a breather or even a minor pull back.
The Standard and Poors 500 volatility Index (VIX) spiked up a bit last Monday, but had returned to historically low values by Friday, closing at 9.6%. Today, Monday, 10/16, VIX opened up a little higher at 9.95%, but this remains historically low. I keep a close eye on VIX. Many market analysts have been predicting a correction simply because VIX has been running at historically low levels. The key is to watch for an increasing trend higher in VIX. VIX is the early warning signal for the correction.
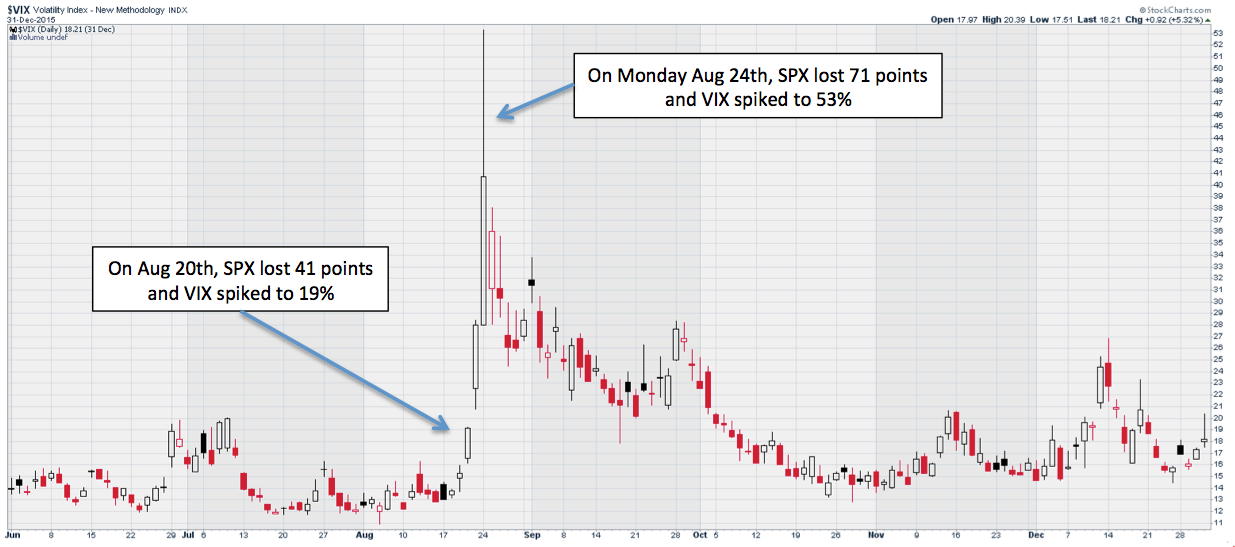
CBOE SPX Volatility Index (VIX)
Chart courtesy of StockCharts.com
Let’s examine the flash crash of 2015 for pointers on impending corrections. I plotted VIX above for the period of June 1st through the end of the year in 2015. The S&P 500 lost 41 points on Thursday, August 20th and VIX popped up to 19%. That was the early warning signal. I closed my positions on Thursday. At a minimum, one should have closed on Friday as VIX rose to 28%. The flash crash occurred on Monday as SPX lost 71 points and VIX spiked to 53% intraday. SPX hit its low on Tuesday at 1867, a net loss of 10% from Thursday’s open. The flash crash on Monday was predicted by the previous two days of spiking VIX values.
I track VIX because it shows us when the largest institutional money managers are beginning to be concerned. And right now, they are as calm as they have been in years. Don’t let the doomsday gurus spook you. You don’t want to miss out on this huge bull market. But we could see a pull back or correction at any time. At a minimum, add trailing stops to your stock positions and contingency stop loss orders to your option positions. Continue to trade from a bullish posture, but keep your stops tight.
- Details
- Written by Dr. Duke
- Category: Dr. Duke's Blog
- Hits: 2443
After the Standard and Poors 500 index (SPX) hit an all-time high on November 8th, the broad market indices traded down steadily until the bullish spike higher yesterday. SPX gapped higher at the open and tacked on twenty-one points before the day’s trading was done. But today was a different story with SPX closing down 7 points at 2579 on declining volume. I think the tax reform soap opera is taking its toll on the markets.
We have nearly completed the earning announcement cycle for the third quarter and it was one of the better earnings cycles with 80% of companies beating analyst earnings estimates. With solid corporate earnings growth, a strong bull market shouldn’t be a surprise. Perhaps this market isn’t as reliant on passage of a tax bill as many have speculated. The recent market slide through this past Wednesday was said to be based on rumors of the tax reform push meeting significant hurdles. If that were true, why did the market pop back so strongly yesterday? If anything, it is becoming clear that the probability of a tax bill reaching the President’s desk is seriously eroding.
The Russell 2000 Index (RUT) has become the anti-establishment index. October 3rd started a steady slide in RUT, giving up 48 points or 3.2% by the close on this past Wednesday – a 3% decline at the same time that the broad market indices were setting new highs. RUT played ball with its big brothers and spiked higher on Thursday. But today’s trading continued higher on Russell, with a close at 1493, up 6 points.The volatility index for the Standard and Poors 500 index, VIX, rose during the recent market decline, from a low of 10.5% on November 9th to an intraday high of 14.5% on Wednesday this week. VIX closed today in much calmer territory at 11.4%.
Continue to trade from a bullish posture, but we need to become more selective in our stock picking. Keep a close watch on your positions and set tight stops. This is a nervous market. I believe we can still achieve some nice gains in this market, but it will pay to be more picky in our trade selection and to quickly cut losses.
- Details
- Written by Dr. Duke
- Category: Dr. Duke's Blog
- Hits: 2600
The Standard and Poor’s 500 Index (SPX) broke out on Monday to set a new all-time high, but that was only the beginning of a very bullish week for stocks. SPX closed today at $2500, the fourth new all-time high this week.
Trading volume of the S&P 500 companies trended right at or just above the 50 day moving average (dma) all week, but spiked much higher today, up to 3.0 billion shares, as compared to the 50 dma at 1.9 billion shares. Today’s spike higher was due to what is called “quadruple witching”, the expiration Friday each quarter when stock index futures, stock index options, stock options, and single stock options all expire. This has always resulted in a high trading volume day in the markets.
The recent trends in the S&P 500 trading volume may be instructive. If we ignore the quadruple witching exception today, this week’s trading volume, as the market hit new all-time highs, was lower than last week, as the market was faltering. That tells me that traders are primarily focused on a fear of correction and avoiding losses. Market commentary this week seemed to focus on rationalizing why the market continues higher in spite of congressional dysfunction and North Korea’s saber rattling.
Last week, traders were worried about hurricane damages, and the week closed with everyone focused on North Korea’s Founders day on Saturday and what the short fat tyrant might do to celebrate. But Monday came and it was a rerun of Happy Days. The hurricanes were suddenly ancient history and even after North Korea launched another ICBM last night, and London endured another terrorist attack before the market opened this morning, the market remained ebullient.
The Russell 2000 Index (RUT) took a breather last week from its remarkable bullish run that started in late August. RUT joined its big brother indices this week and ran higher, but the difference is that Russell remains well short of its all-time highs that were set back in July. The collapse of RUT from July 28th to August 21st covered 6.4% - near market correction territory. Its run higher since then has been significant, up 5.4%, but it had a lot more to recover than SPX and the NASDAQ Composite. RUT closed today at $1432, well short of the $1450 close on August 25th. RUT seems to be behaving as the leveraged version of the S&P 500 Index. In one sense, this isn’t surprising since RUT is made up of higher beta stocks, but the behavior over the past several weeks seems extreme.
The NASDAQ Composite’s price action this week is unlike SPX or RUT. NASDAQ closed today at $6448, attempting unsuccessfully twice this week to break the resistance level set by the opening high of $6460 on July 27th.
NASDAQ trading volume was similar to SPX, trading at or just under the 50 dma all week, with the exception of today’s quadruple witching volume spike.
Market volatility remains historically low. The volatility Index for the Standard and Poors 500 Index, VIX, moved lower all week, closing today at 10.2%. I read and heard market analysts this week expressing concern that such low levels of volatility must be predicting a correction, but they are proving the old adage that the market can continue trading however it wishes far longer than your money will last.
I displayed the price charts for SPX, RUT and NASDAQ for the past 18 months and looked for the overall long-term trend. The differences were intriguing. Russell has run steadily higher since March 2016, but has largely traded sideways since May. However, Russell takes the prize for price volatility. NASDAQ displays a solid uptrend from July 2016 through July of this year, but is largely flat for the past six weeks or so. The S&P 500 has the steadiest and most consistent upward trend line from March 2016 to today’s close. This index price chart comparison reinforces the conclusion that the overall market trend is bullish, but far from a high trading volume, “risk off” or “all in” bull market. Market participants are enjoying their gains but worried that it has gone too high, too fast. We see rapid dips that are just as quickly bought back to recover the bullish trend. The more defensive stocks of the S&P 500 display the steadiest and most consistent bullish trend. The bulls are in control, but they are also nervous. Congressional dysfunction and North Korea are the “monsters in the closet”. Continue to trade largely from a bullish posture, but keep your stops tight. Don’t short this market. I was protecting my portfolio with long index puts last Friday and was burned on Monday as the markets shrugged off all worries to run higher.

