Dr. Duke's Blog

Do you know any trading coaches who discuss the market candidly without any marketing hype? Dr. Duke publishes a weekly newsletter and shares the track records of his trading services. If you have questions about any of his services, Ask Dr. Duke.
Interesting Dichotomy
- Details
- Written by Dr. Duke
I was surprised to see SPX and RUT move in opposite directions today. SPX closed lower by $4 at $2040, but RUT actually traded higher, closing at $1216, up $7. The VIX increased by a couple of tenths to 16.9%, so there wasn't much change there. Trading volume fell on all fronts, with 2.1 billion shares of the S&P 500 stocks trading today, below the 50 dma of 2.2B. Trading volume declined 7% on the NYSE and declined 3% on NASDAQ.
There wasn't any significant economic data issued today, but we will get both retail sales and the weekly unemployment numbers tomorrow. A solid retail sales number could calm this market, but recent retail sales data have been weak.
Perhaps this mixture of a lower SPX with a higher RUT suggests an equilibrium being reached? If so, maybe we are back into the sideways trading range from January. But a weak retail sales number tomorrow could easily push us lower to test that 200 dma on SPX around $2002.
My March condor on RUT stands at a net gain of 6.2%; the delta of the short 1160 put is 8 today. It is borderline whether we will close the put spreads Friday with the Two Sigma Rule. If volatility expands, we will be closing the March put spreads; if not, we may be able to safely leave them open through the weekend.
Ouch!
- Details
- Written by Dr. Duke
That jab in the nose hurt! SPX dropped $35 or 1.7% to close at $2044. SPX didn't even hesitate at the 50 dma at $2061. RUT lost $15 or 1.2% today, closing at $1208. $1210 was the high reached twice in 2014 by RUT and that level also served as resistance in early February before RUT took off to set new all-time highs. RUT's 50 dma is at $1203, but this market may give back more than that before it is done. Volatility is starting to heat up, with the VIX gaining 1.6 points today to close at $16.7%. That places us back in the range of volatility from the choppiness we endured in January.
Conventional technical analysis would conclude from today's price action that we are now back in that choppy range from January, roughly $1990 to $2065. The 200 dma is at $2001, just above that support level at $1900. Today's price takes us down 3.4% from the high on March 2nd. If you follow Fibonacci retracements, the 62% retracement level is at $2034 on SPX. I have not used Fibonacci much myself, but I have been surprised how often those numbers seem to arise. That $2034 level would be a 4% correction, similar to what we saw in mid-December and early January. In any case, all one can do is mark some points where positions must be adjusted or closed, watch what the market gives us each day, and take appropriate action.
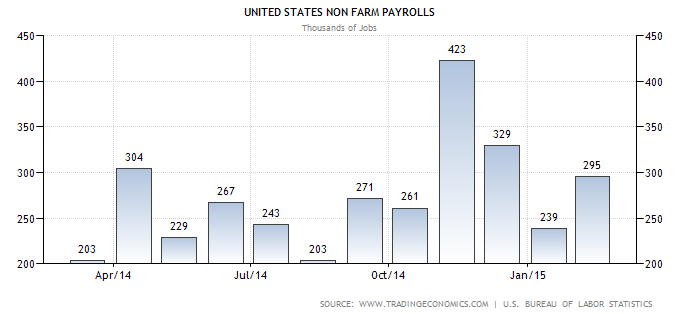
The conventional wisdom for this correction appears to be the "unusually good" jobs report causing traders to expect increased interest rates from the Fed sooner than expected. I explained why I thought that unlikely yesterday, but I found a nice graphic illustrating the problem. In the chart below of the non-farm payroll numbers for the past 12 months, it is hard to see the February number as "unusually good". In fact, it's hard to identify a trend. But I received that headline on my phone from Yahoo Finance as the explanation for this market pull back, so it must be true.
My March iron condor position on RUT stands at a net gain of 2% (increased implied volatility pulled it back), and delta for the position equals +$57 and position theta = +$229. Delta of the short $1060 puts = 12, so we are pretty safe at this point. We will hit our two sigma rule Friday, so we may be closing the put spreads then if not before. The April condor is delta neutral (position delta = +$19 on 20 contracts) and is showing a small gain of 1% at this point. Hold on for the ride!
Is It Safe To Come Out?
- Details
- Written by Dr. Duke
After all of the doomsday prophets on Friday, one had to wonder what might happen today. One day doesn't make or break a trend, but today's market action was encouraging. SPX traded as high as $2083 before settling back at $2079 for a gain of $8. RUT followed suit with a gain of $6, closing at $1224. Volatility was basically unchanged with the VIX closing down a tenth of a point to 15.1%. Trading volume was down from Friday's high numbers, with two billion shares of the S&P 500 stocks trading; the 50 dma is 2.2B. Trading volume dropped 16% on the NYSE and decreased 11% on NASDAQ.
Friday's sell-off was sufficient to push IBD to move from "Confirmed Uptrend" to "Uptrend Under Pressure". Watch their web site this evening to see if that moves to "Market in Correction" - probably not after today's small gains.
There was no economic news today, but I looked up the non-farm payroll data for the past twelve months. The conventional wisdom for Friday's sell-off was something to the effect that such an "unusually good" jobs report would cause the Feds to increase interest rates in June rather than September. When I look at the data, it is pretty choppy and I fail to see February's 295k as "unusually strong". We had 304k back in May of last year and 423k in November. The only thing positive about the February number is that it saved us from drawing a downward trend line from November through February (December was 329k and January reported 239k). I'm not convinced this is the definitive "last word" for Yellen's assessment of the economy. For now, remaining bullish appears to be the safer alternative. Whenever interest rates begin to rise, it will slow the economy, and that is precisely why I think the FOMC will be slow to take that step when we are still observing mixed data.
Taking Profits and Waiting on Friday
- Details
- Written by Dr. Duke
Traders continue to tread water with an eye toward Friday's jobs report. SPX closed down $9 at $2099, and RUT traded down $4 to $1231. SPX opened lower this morning and traded down to $2088 before bouncing around 11 am ET, and then traded sideways the rest of the day. Both today and yesterday's intraday lows strengthen the support level of $2090 on SPX. Also note the long lower shadows on yesterday and today's candlesticks - another indication that the bulls remain in control.
Traders were concerned about the market's reaction to the Beige Book (FOMC minutes from the last meeting). As it turned out, there was no reaction whatsoever. Trading volume continued to be flat with two billion shares of the S&P 500 trading. Trading volume on the NYSE rose 3%, but declined 8% on NASDAQ. Volatility rose a bit both yesterday and today, with the VIX closing at 14.3%.
The ISM services index came in at 56.9 for February, about even with last month's 56.7. ADP reported their private payroll number for February at 212 thousand jobs, down from January's 250 thousand. Does that foretell a weak jobs report Friday? Perhaps, but the correlation has been tenuous historically. But it will cause traders to stay on the sidelines until after the jobs report. The only probable activity tomorrow will be to take some vulnerable profits off the table.
The Bulls Run Again
- Details
- Written by Dr. Duke
Just when it seemed that the bulls might be taking a rest, they come roaring back. SPX gained $13 to close at $2117 and RUT closed at $1243, up $9. Volatility continues to contract with the VIX dropping about a third of a point to 13.0%. Trading volume remains anemic with 2.1 billion shares of the S&P 500 trading. Trading was up 2% on the NYSE and up less than one percent on NASDAQ.
Over 90% of the S&P 500 companies have reported fourth quarter earnings at this point and about 75% have beat the analysts' earnings estimates. Concern about the strong dollar hurting the earnings of the multinationals appears to have been overblown. The Greek debt problem is certainly not solved, but traders seem to have moved on.
The pattern appears to be: 1) the bulls push higher, 2) bears present a "sky is falling" scenario, 3) markets trade sideways while we worry, and then 4) the bulls push higher.
Will Friday's jobs report be the next focus of worry?
Flat Week
- Details
- Written by Dr. Duke
SPX opened the week at $2110 and closed today at $2106, down $6. It was slightly down, but in broad brush terms, it was a flat week. RUT lost $6 to close at $1233. The NASDAQ composite did the best of the major indexes, up about $11 for the week at $4964. Trading volume has been below average all week on SPX, ending the week at 2.1 billion shares. Trading volume was up 3% today on the NYSE, but unchanged on NASDAQ. The VIX opened the week at 15.1% and closed today at 13.6%, down 0.4 points today. So the market averages may be a bit flat, but traders aren't concerned. The bull market appears to be intact.
The second estimate of GDP for the fourth quarter came in at +2.2% today, down from the first estimate of +2.6%. Why can't we just get it right and report it once?
The Chicago PMI reported its lowest level since 2009 for February, 45.8, down from 59.4. Most analysts blamed the decline on the harsh winter and the West coast port strike. Pending home sales increased 1.7% in January, so the real estate market continues to be solid, but not too hot.
Stay warm and enjoy your weekend.
Slow and Steady
- Details
- Written by Dr. Duke
The markets continue to trade sideways to higher; today was one of the sideways days. But make no mistake; the bulls are in charge. SPX actually lost a couple of dollars to close at $2114, while RUT gained $1 to close at $1235. Trading volume was flat with two billion shares of the S&P 500 stocks trading; trading volume rose 3% on the NYSE and was essentially unchanged on NASDAQ (to be precise, up 0.2%). Volatility was also essentially flat with the VIX at 13.8%, up 0.2 points.
New home sales came in at an annualized rate of 481k for January, essentially flat with December's 482k. A few days ago, we saw existing home sales drop a bit for January, so this number is somewhat reassuring that a "meltdown" isn't occurring in real estate. And recall that the Case Schiller price index remains pretty high at 4.5%.
If we just study the price charts, we see that SPX broke out of the consolidation triangle pattern back on February 5th and has been trading higher ever since. Now it slows a bit, but the bullish trend is very much intact. It is the classic stair step progression of a bullish trend. Even Greece couldn't derail the bulls. And Yellen promises more easy money, so what's not to like? Farmers are loaded with common sense wisdom; I am reminded of their saying, "Make hay while the sun shines."
Good News?
- Details
- Written by Dr. Duke
Janet Yellen testified before the Senate Banking Committee today, and appeared to be reluctant to commit to raising interest rates too soon. Markets took that as good news and traded higher. But is it good news? It suggests the FOMC chair still doesn't feel confident about the unemployment picture and has concerns about a deflationary spiral similar to what Japan has suffered through the past several years. Most Fed watchers are predicting the first interest rate hikes in September.
SPX traded up $6 to $2115, but RUT was less enthusiastic, closing at $1234, only up $2. Volatility continued its contraction with the VIX falling almost a full point to 13.7%. SPX and RUT both set new all-time highs. The NASDAQ composite also traded higher, but remains about eighty points below its all-time high.
The Case Schiller housing price index published its December numbers today, +4.5%, up from November's +4.3%. The Conference Board's consumer sentiment survey came in at 96.4 for February, down from the exuberant 103.8. Are gas prices that core to consumer expectations? Maybe.
The bulls remain firmly in charge, although the charts seem to suggest some slowing of the charge higher. In any case, being bearish is very contrarian at this point.
Waiting On Yellen
- Details
- Written by Dr. Duke
Traders were largely on the sidelines today, probably waiting on Yellen's testimony before Congress. And it wasn't too surprising to see some pull back after such a strong day on Friday. SPX closed down $1 at $2110 and RUT was unchanged at $1232.
Trading volume was flat to down with 1.9 billion shares of the S&P 500 stocks trading; the 50 dma = 2.25B. Trading volume declined 7% on the NYSE and was flat on NASDAQ. Lower trading volume is normal after expiration Friday, but it is also consistent with traders taking a pause while waiting on Yellen's remarks. The market is anxiously looking for clues about when the Fed may begin to raise interest rates.
Volatility rose slightly with the VIX closing at 14.6%, up 0.3 points.
Existing home sales for January came in at an annualized rate of 4.82 million, down from December's 5.07 million.
I think it is safe to continue to play the bullish trend, but the higher the markets move, the more likely a correction becomes. Don't play without a safety net.
Pop!
- Details
- Written by Dr. Duke
The news out of Europe appears to be getting better with at least a temporary solution, and the markets responded accordingly. The Greek debt problem hasn't been solved, but who cares? Politicians are kicking the can down the road. SPX opened down this morning but started climbing at 10 am ET and never stopped. SPX closed at $2110, up $12, within a few cents of its intraday high. Many analysts had suggested $2100 would give resistance, but SPX motored through that level without hesitation. RUT followed suit, but not quite so strongly, closing up $4 at $1232. The VIX declined one full point to 14.3%. Today was expiration Friday, so we usually see some increased trading volume, but it wasn't significant with 2.1 billion shares of the S&P stocks, still below the 50 dma. Trading on the NYSE increased 2% and trading increased 11% on NASDAQ.
SPX settled at $2094.87 and RUT settled at $1228.33. This confirmed the closing of our February RUT 1070/1080 put spreads, resulting in an 18% gain.
For those of you that trade SPX and VIX options, be sure you note the new trading hours beginning in March. Those options will trade five days per week from 2:00 am CT until 8:15 am CT. Trading in the new hours will begin for VIX options on March 2nd, and begins March 9th for SPX. Check the CBOE web site for more information.
Enjoy your weekend.


